


In Summary:
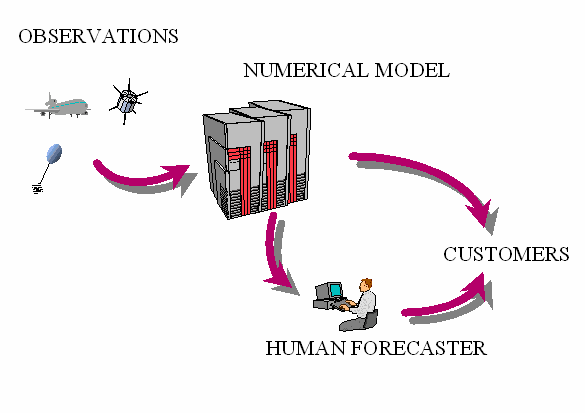
Observations(measurements & error checking and data quality checks)
Dissemination to forecasting organizations
Forecast (numerical weather model)
Forecast clients
1. Observation Types
|
Meteorological intruments are divided into three classes:
Manned (with various levels of automation) weather obervations are taken globally at regular synoptic times: 00Z and 12Z for radiosondes and 00, 03, ...., 21, 24Z for surface observations. These measurements are then encoded and the information transmitted to regional centres and on to international centres. Data collected globally at NCAR of the order of one terabyte per day!! Satellite, aircraft and radar observations are taken continuously (asynoptic) and forwarded to special centres for processing and further dissemination. Data being collect will always have some error that needs to be corrected for. These error characteristics of meteorological observations are complex and take on various forms:
These errors can be either random or spatially or temporally correlated with each other or the synoptic situation, and there can be systematic biases. E.g. radiosondes can be incorrectly shielded from the sun yielding a systematic temperature bias. |
|
How are observations made? |
|
Surface data |
|---|
|
|
|
These comprise, land synop, marine surface data from ships and buoys, and also wind data derived from measurements of ocean backscatter observed from satellite. Surface pressure is usually reduced to a mean sea-level pressure for reporting and plotting purposes, although some stations report pressure at the station altitude and some high-level stations compute a pressure at 850 hPa. Wind data is taken as at either 2m, 10 m or 25 m depending on the observing system. |
|
Radiosondes |
|
|
|
The radiosonde system provides a standard set of measurements of wind speed and direction, temperature and dewpoint temperature (TEMP reports). The dewpoint data provides information on moisture and is usually combined with the temperature data to provide the moisture information as relative humidity. Optionally a balloon-only ascent without the temperature measurements yields wind only (PILOT reports). In addition to standard reporting levels (1000, 925, 850, 700, 500, 400, 300, 250, 200, 150, 100, 70, 50, 30, 20, 10 hPa), the reports also contain additional non-standard levels in order to build a detailed picture of the atmosphere at that location. In some reports there may be in excess of 100 levels. The vertical averaging maps these reports on to the model layers. |
|
Aircraft observations |
|
|
|
Whether from manual or automatic reporting systems, these are passed to the assimilation as reported after the vertical position has been converted from a flight level to a pressure. Both temperature and wind information at a level is available. Representivity is more of a problem with aircraft reports than some upper-air observation systems, particularly in the vertical. Planes flying in the direction of the wind tend may seek the jet core which is of limited vertical extent and thus may be sampling part of the atmosphere which is not fully resolved by the model (where typically the vertical resolution may be only 50 hPa). The two automatic reporting systems ACARS (Aircraft Communication Addressing and Reporting System) and ASDARs (Aircraft to Satellite Data Relay) are collectively known as AMDARs (Aircraft Meteorological Data Reporting) systems. It is envisaged that these will ultimately replace the manual system which are known as AIREPs. |
|
Satellite winds |
|
|
|
Atmospheric motion and hence wind reports derived from successive geostationary satellite images (infrared, water vapour or visible) provide data similar to an aircraft wind report. Representivity problems are usually not as severe as those associated with aircraft data, since the observing technique implies that a volume measurement that is comparable to model resolution is provided. |
|
Satellite temperatures |
|
|
|
Radiance measurements from the polar-orbiting satellites provide a potentially valuable source of temperature information, in data sparse regions. The assimilation process currently requires a transformation from radiance to temperatures. Used judiciously (e.g. with appropriate quality control and permanent rejection) they have an impact particularly in the southern hemisphere. The move towards more sophisticated assimilation methods (such as variational analysis) has been partly driven by the need to treat satellite data more optimally. |
|
|
Global Observation Coverage
ECMWF - European Centre for Medium-Range Weather Forecasts
<>
SYNOP - WMO (World Meteorological Organization)
code for surface weather observations <>
ATOVS -
Advanced Tiros Operational Vertical Sounder (incoming radiation and
passive microwave) <>
SATOB – GEOS
(Geostationary Operational Environmental Satellite) - derived wind
product <>
QCSAT – QwikScat - microwave
scatterometer
ARGO - Ocean robots, temperature and salinity
(1500 installed, 3000 planned)

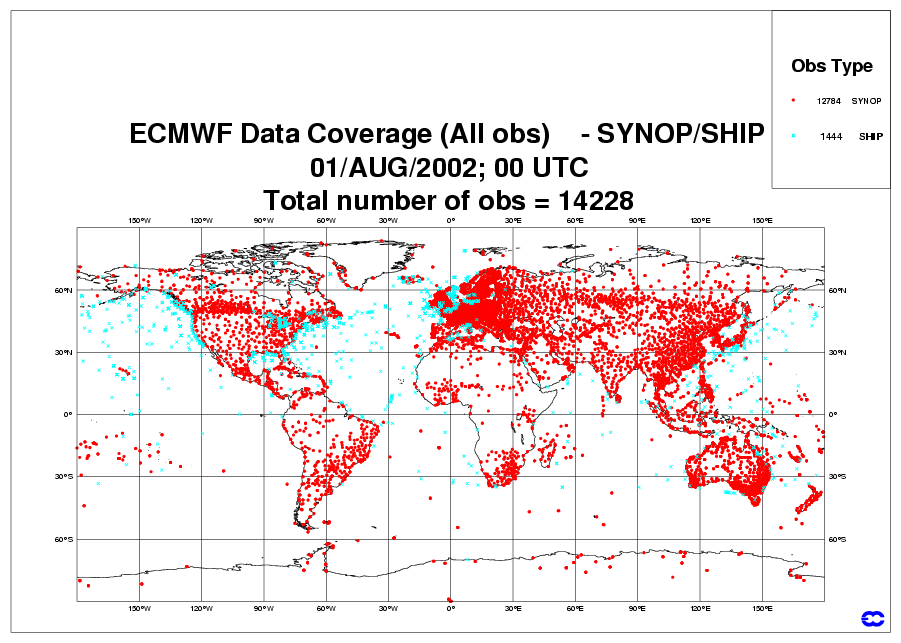


That's 462557 observations on this day!! (Using only these 5 sources, there are more!)
2.
Quality Control of Observation Data
All weather forecasts (subjective or objective) depend a great deal for their success on the quantity and quality of the basic observation data.
In numerical forecasting, errors in observation data need to be detected automatically - This requires complex algorithms (something which can be done relatively easily by a human forecaster who can spot a rogue observation almost instantly).
The computer must be given very precise rules to distinguish between correct and incorrect values such that incorrect values are rejected but correct observations, especially when they have an extreme value, are accepted.
Some of the basic checks that are performed on observation data are:
Station location (e.g. ships over land)
Physical reasonableness off observation (each variable is given reasonable boundaries)
Buddy-check (observation compared to its neighbours for consistency both spatially and temporally - looking for the odd man out)
Checked against the background field (large changes flagged or rejected)
Physical laws used to cross-check variables (e.g. geopotential height against temperature)
The trick is to give the computer something clever to do - the more you think about it the more complex it becomes. Furthermore, the quality control algorithms must run as quickly as possible so that the numerical model can start timeously.
3. Global Telecommunication
Meteorological
phenomena transcend national boundaries and so an observation network
would require international cooperation. Observing practices, units
of measurement and observation times have to be standardized.
The
International Meteorological Conference
of Vienna in 1873 formed a diplomatic
basis for international cooperation. So by 1900 a global real-time
observing system was in place. It was crude and mainly had
observations at the surface over land. Gradually with time this
improved until in 1979 the Global
Weather Experiment was organized to
observe the atmosphere as systematically as possible using the most
advanced technology. This saw the launching of special observing
systems, such as drifting buoys in the oceans.
Today we have a system known as the World Weather Watch (WWW) that is supervised by the World Meteorological Organization (WMO), a United Nations agency based in Geneva, Switzerland. The WWW has three components:
Global Observing System (GOS) - Basic observation networks run by national meteorological services (NMS)
Global Telecommunication System (GTS) - Telecommunication facilities for rapid transmission of observational data and processing thereof, available to NMSs
Global Data Processing System (GDPS) - Has world meteorological centres in Melbourne, Moscow and Washington D.C., to collect, store, process, archive and disseminate observational data in real time.
"...One of the worst snowstorms in living memory struck the U.S. mid-Atlantic states during 18-19 February 1979. Total snowfall amounts exceeded 0.5 meter and high winds created wind drifts up to 2.5m. Airports and roads were closed from Atlanta to New York City, and a state of emergency was declared in many areas. This legendary storm became known as the Presidents' Day snowstorm, not only was it severe but was exceptionally poorly forecast..."
"...investigators discovered that the predicted evolution of the Presidents' Day snowstorm was extremely sensitive to small errors in the initial analysis in the Northwestern Pacific four days earlier..."
This highlights not
only the importance of good observations but that these need
to be used appropriately to produce the
best possible initial state of the atmosphere,
i.e. the process of analysis.
Subjective Analysis
The synoptic chart was a major breakthrough in the quest to represent meteorological information in a coherent fashion on a map. It shows isobars (constant pressure) or contours of pressure heights, isotherms (constant temperature), streamlines (tangents to wind direction), constant dew-points, isotachs (constant windspeed) and station symbols representing cloud cover, wind direction and speed, temperature and humidity.
These synoptic charts were drawn
by hand (and is still partly done today in some forecast
centres). The process is called subjective analysis as the
diagnosis and analysis relies entirely on the personal judgement of
the forecaster/analyst.
Station symbols
http://ww2010.atmos.uiuc.edu/(Gh)/guides/maps/sfcobs/home.rxml
Objective
Analysis
This automated procedure works without human intervention (objective) and estimates atmospheric variables on a two- or three-dimensional grid using data from the irregularly spaced observation network.
It was realised that the analysis could be improved by providing a preliminary estimate of the analysis taken from climatology or preferably a previous numerical model forecast. This previous estimate is called the background field or first guess field.
This backround field was then subtracted from each observation to yield an observation increment. These were analysed to produce analysis increments which were then added to the background field to produce the final analysis.
There are a number of observation voids in the global observing system where new observations are rarely received (typically vast ocean areas of the southern hemisphere). With the use of numerical models the information received by the model in data-rich areas is gradually propagated into the data-poor areas and these new data are contained in the background field in a later analysis cycle. Without new observations the background field will pass as the new analysis in these areas.
In a cyclic
process the objective analysis will become reasonably accurate all
over the globe with time. In reality numerical modelling centres
never do a cold-start
in an operational environment. New
techniques will be run in test
mode parallel to the operational
system for several months and are only implemented after intensive
testing.
Initialization
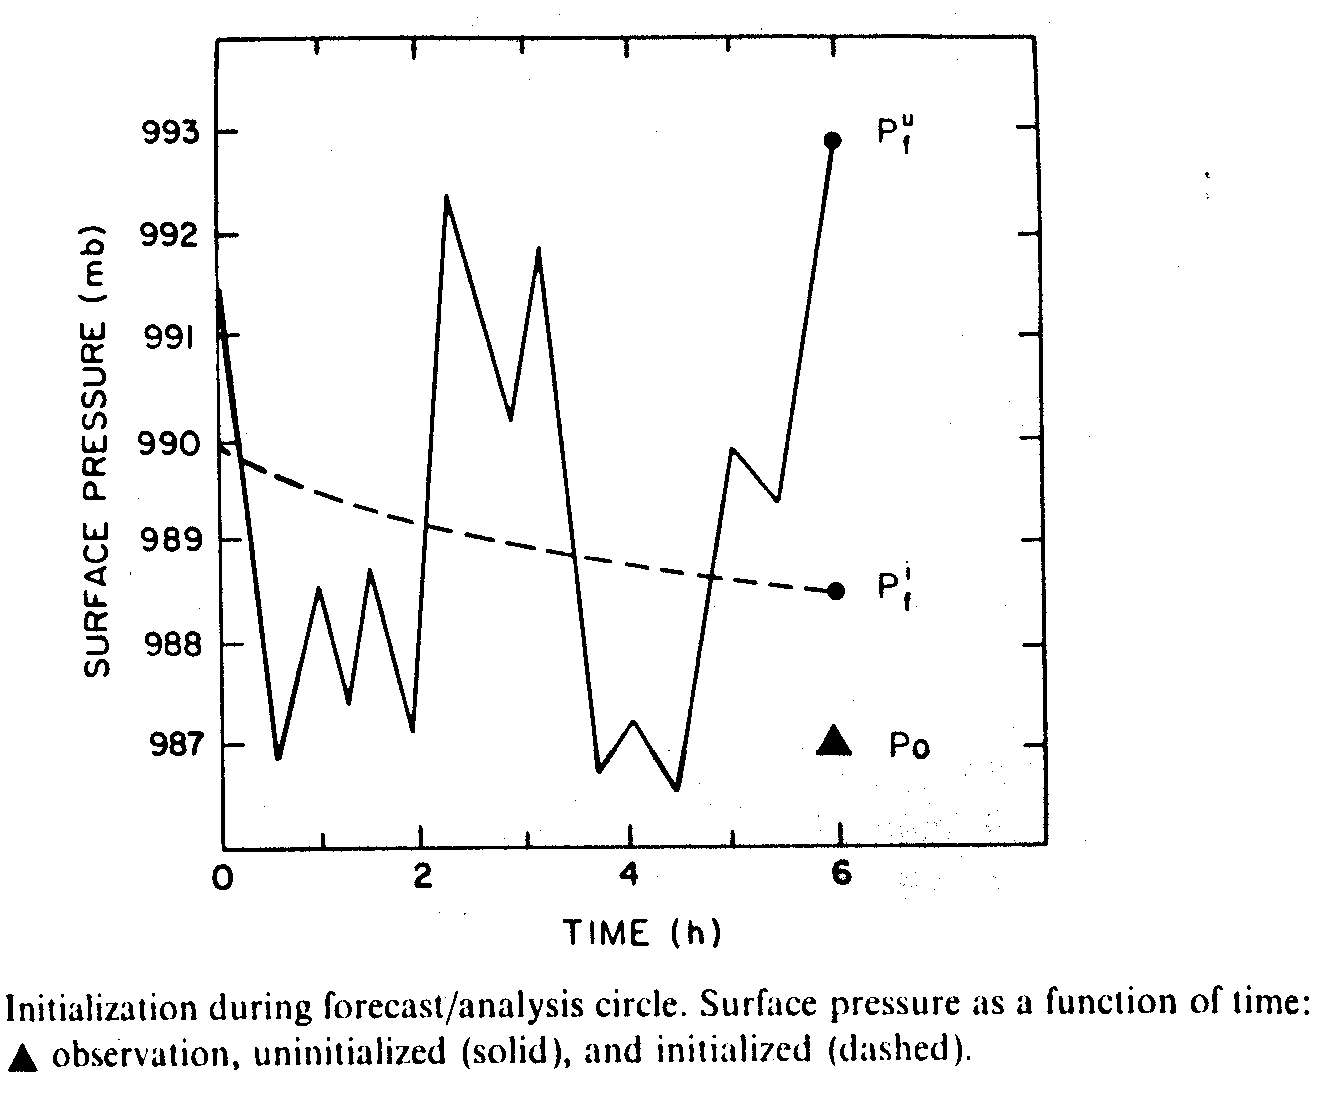
Numerical models need to be initialised! Without initialization the variables in the model would oscillate rapidly during the first 6 to 12 hours of the forecast. Initialization involves bringing the wind and mass (temperature) fields into balance. As seen in the figure below the observation increment from the unitialized forecast is far larger than from the initialized forecast. This is detrimental to the data assimilation cycle as the unnecessary large increments would agrivate the spurious oscillations further.
Data Assimilation
The multi-stage cycle of producing an analysis became known as data assimilation, and can be thought of consisting of four components:
Quality control - processing and checking observation data
Objective analysis - updating an existing gridded representation of the atmosphere from the observations
Initialization - bringing the wind and mass (temperature) fields into balance
Numerical forecast - a short forecast (3 or 6 hours) to produce the background field for the next analysis
Continuous data assimilation assimilates observations at the same rate at which they are observed but somewhat behind real time to allow for gathering and processing the observations. The numerical model is continually adjusted to fit the new observations and a routine forecast can be initiated at any time. However, 00Z and 12Z have the most observations and numerical model forecasts are generally initiated at these times each day.
Usually, data assimilation
proceeds sequentially in time. The model
organises and propagates forward the information from previous
observations. Then new observational data
is received and is used to modify the model state, to be as
consistent as possible with reality.
Since all information has to be represented within the model, it is important that the model should be of sufficiently high resolution, with physically realistic detail, to represent the information observed.
Recommended
reading:An
article by A.C. Lorenc at a WMO Symposium on Assimilation of
Observations in Meteorology and Oceanography
Weather Forecast Clients
Weather forecasts are used in
numerous sectors and are used to answer many questions other than
"What shall I wear today?". There is
an endless list of users of weather forecasts from the short- to
extended-range. Some of the higher profile users include:
Aviation: Airlines require METAR observation reports and TAF forecasts as part of their operations. The SA Weather Service's major commercial client in the aviation industry. Bad weather is a major contributor in aircraft accidents.
Marine: Deep-sea traffic rely on forecasts for their very survival, as winds and swell at sea can be especially treacherous (particularly between 40 and 60 degrees south). Fishing vessels in coastal waters are also vulnerable to poor weather and many have ended up on the rocks, often from not heeding weather warnings. Harbours and oil-drilling platforms need advance warning of heavy swell and strong wind (wavelength and direction are particularly important in this instance)
Agriculture: Tactical planning (planting, ploughing, harvesting); warnings (cold-fronts for Angora goats, dry winds for forestry, drought)
Government: Disaster management needs to be alerted to imminent flooding and other weather-related disasters. Disaster management relies on forecast information. Relief efforts during the Mozambique floods early in 2000 consisted of an international collaboration between the SA Weather Service and the Mozambique Meteorological Service. Water-management of large catchments (Vaal-Orange system).
Commercial activity: Sales and marketing of beer, clothes, ice-cream; building work and civil engineering; tourism; sports events.
Public: Service to the nation as a whole so they know what to wear, whether to water their garden or not, can they go on holiday/hiking.
Weather Forecasting centres worldwide: